By Theresa Batoon, Catalyst Strategic Solutions Senior ALM Consultant
Weighted Average Life (WAL) is an important calculation that measures the characteristics of an investment instrument or portfolio. More specifically, it can help credit union investors evaluate how long it may take to receive approximately half the outstanding principal and measure interest rate risk associated with fixed-income securities. For these reasons, it’s important to understand how WAL is calculated and examine some of its uses, as well as its limitations.
What exactly does WAL assess and how is it calculated?
WAL is the average length of time, or average life, that each dollar of unpaid principal on a loan, mortgage or bond remains outstanding. To calculate this “average life” – as seen in the formula below – multiply the time remaining until each payment is due (expressed in years or months) by the dollars of principal paid by that date. Add the results of each calculation and divide by the total principal balance.
Calculating WAL:

The PrinCF property contains three components: 1) amortization cash flow, 2) prepayment cash flow, and 3) any principal loss recovered.
This subset of the calculation is expressed as:
PrinCF(t)= AmortCF(t) + PrepayCF(t) + PrinLossRecovered(t)
Where PrepayCF(t)=PrepayAmount(t)+A(t).
Note: PrepayAmount(t) refers to principal cash flow due to prepayment, and A(t) is the call amount at time t.
What insights can WAL provide?
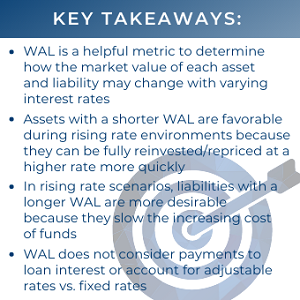
WAL serves as a valuable metric for determining how the market value of each asset and liability may change with varying interest rates. Ultimately, assets with a shorter WAL are more favorable in rising rate scenarios, as the shorter duration equates to being fully reinvested or repriced at a higher rate faster. In down rate scenarios, the opposite holds true, since adjusting or reinvesting to a lower rate more quickly would mean lower interest income.
Liabilities, however, work in reverse. Lower WAL for liabilities would be unfavorable in rising rate scenarios, as it would cause deposit or borrowing rates to increase more quickly. In down rate scenarios, it would be more advantageous to have a shorter WAL, because cost of funding would decline at a faster pace. Therefore, longer WAL for liabilities in rising rate scenarios is more desirable since it slows the increase in cost of funds.
For example, a credit union deciding to generate more 30-year real estate loans would cause a higher WAL and a potentially unfavorable effect on long-term interest rate risk in rising rate scenarios.
What are its limitations?
It’s important to note that WAL does not account for adjustable rates vs. fixed rates. An adjustable-rate mortgage can have the same WAL as a fixed-rate mortgage but carry much different interest rate risk. Therefore, WAL is really a better measure of cash flows and how soon they will need to be reinvested than a comprehensive measure of interest rate risk.
All in all, WAL is a useful tool for measuring and understanding the risk profile of your institution. It may not always be a “silver bullet,” but it helps to know the benefits and shortcomings of this common risk measurement tool.
WAL reporting is one of many key data elements provided by Catalyst Strategic Solutions’ ALM service. Our team of highly experienced consultants can assist you and help interpret the results. For more information, contact us today.